
H1 Results & Outlook for H2
Full transparency

Hi all,
I wanted to do a H1 recap, and a look through to H2. It’ll be a short punchy article with the following contents:
Contents
What my service is going to look like in H2 26.
H1 Results
Overall Performance
Biggest Winners & Biggest Losers
Portfolio at H1 Close
What I am thinking into H2 and where I see my portfolio ending the year.
Opportunities I see at the moment not in the current portfolio.
What my service is looking like for H2 2026
Just a quick note here:
I want to share a few plans I have for the rest of the year.
I’ve been working very hard on a web-app as you all know so far. You can see the link to the app here.
This is only a beta version that is going through rigorous testing and upgrades. Here’s a couple of the upgrades I’m working hard on right now:
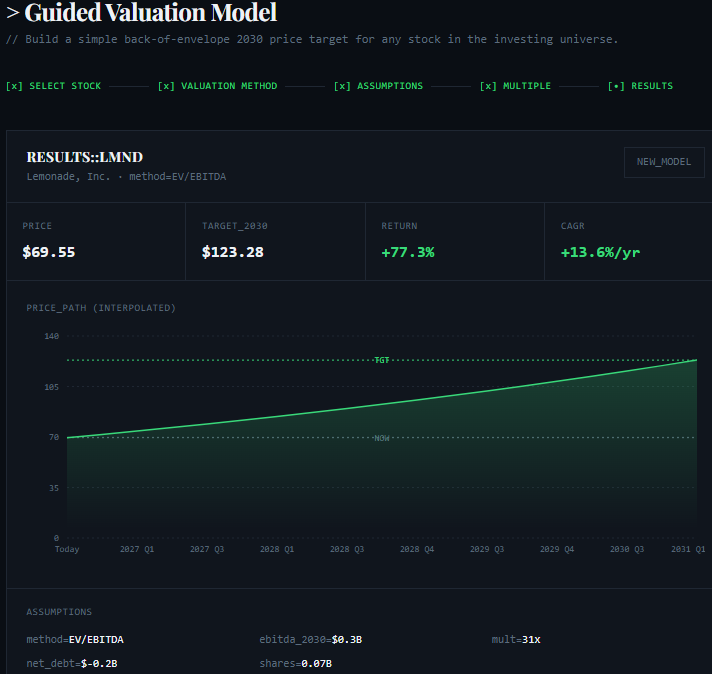
Guided Valuation Model (EV/Sales, EV/EBITDA, P/E, or MMMT Valuation Model) for every stock in my universe - see screenshot above.
This allows you to input your assumptions (or follow my assumptions) and come out with a target price.
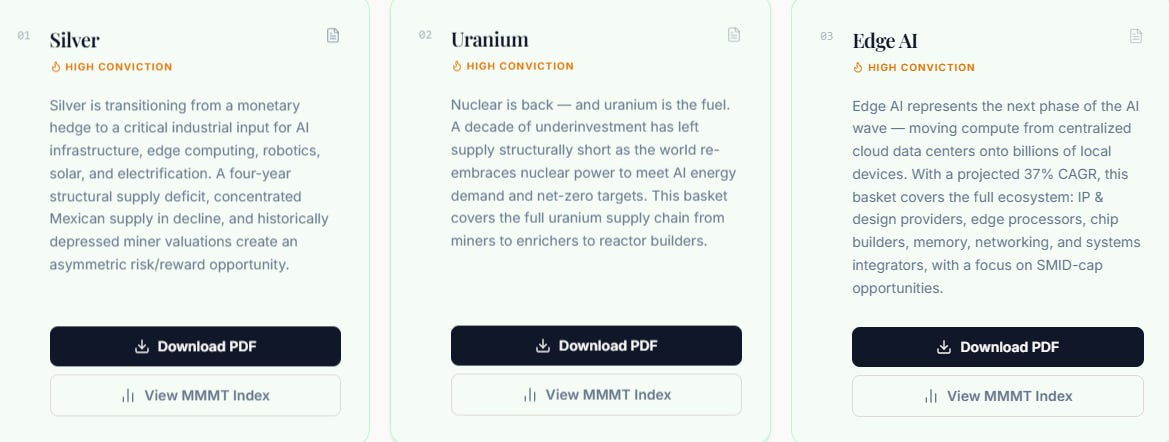
Stock Baskets: As well as showing my personal portfolio as evidence of my track record, I’ll be showing you concentrated stock baskets of the best themes in the markets.
These aren’t ETFs. These are 5-10 stock baskets for all themes in the market with individual stocks and weightings.
I think of it as a way of introducing you to other high conviction plays I have that I don’t necessarily personally own due to capital. I also think it’s a great way to increase your exposure to a theme that you may like more than I do.
This is all on top of daily notes, live portfolio, technical screens, and research notes.
H1 Results
H1 results were really good at 25.4% YTD.
Considering we were down YTD in the March dip, we’ve come back nicely with some quite material wins to bring me up to 25.4% YTD so far meaning if these kinds of returns continue I’ll come out somewhere near my 2024 and 2025 returns of 47% and 48% respectively.
I will be adding a live tracker of my YTD on the next version of my beta web-app release. I’m fully aware it’s not there yet but the calculation to track it live isn’t that easy with the way I invest.
Biggest Winners & Biggest Losers
My biggest winners have been:
Ouster | OUST: We’re now +115% at the time of writing this with a $23 average price and a first buy in January ~$24. Early to the game on this one.
Nebius | NBIS: Still up +135% even despite this weeks dip post META announcement.
Solaris Energy Infrastructure | SEI: Currently +80% on SEI with an average cost of $37.
Credo Technology | CRDO: Frustratingly my average cost on CRDO wasn’t as good as it could’ve been, but I still am up 71% in a few months on this.
AbCellera Biologics | ABCL: This has been a long term position for me over the last year that has been range bound until the recent biotech breakout. I’m now up 76% on the position.
Those winners are all unrealized / i.e. stocks I still hold.
Some of my realized gains are here (see screenshot):
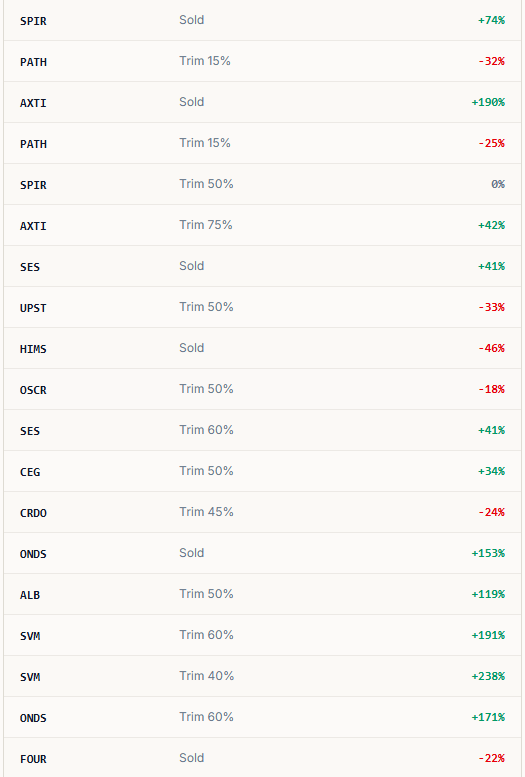
You’ll note there’s some losers in there which I’ll touch on in the section below, but notice how the winners far outweigh the losers in terms of size (and win rate):
Ondas Holdings | ONDS: A very quick move for a swing trade that nearly got 200%. I sold in the end for 171%.
Albermarle | ALB: ALB turned out to be a great trade for me. I managed to get 119% on the investment and perhaps sold too late as it broke the $150 support level. I was up nearly 200% on ALB at one point. A clear thematic trade.
Silvercorp Metals | SVM: This was my original higher risk play on the silver market with an average cost ~$3.50 and nearly a 3x move.
AXT Industries | AXTI: I rode the initial hype around this name but only for a 42% gain. In hindsight, one I regret selling so early.
SES AI | SES: You’ll see more on this below.
Redwire | RDW: RDW is also there but didn’t fit into the screenshot. That was a 112% winner though.
Sanmina | SANM: I bought SANM at $125 when it traded at ~0.5x sales and 7x EBITDA which for one of the few PCB players in the market seemed too cheap.
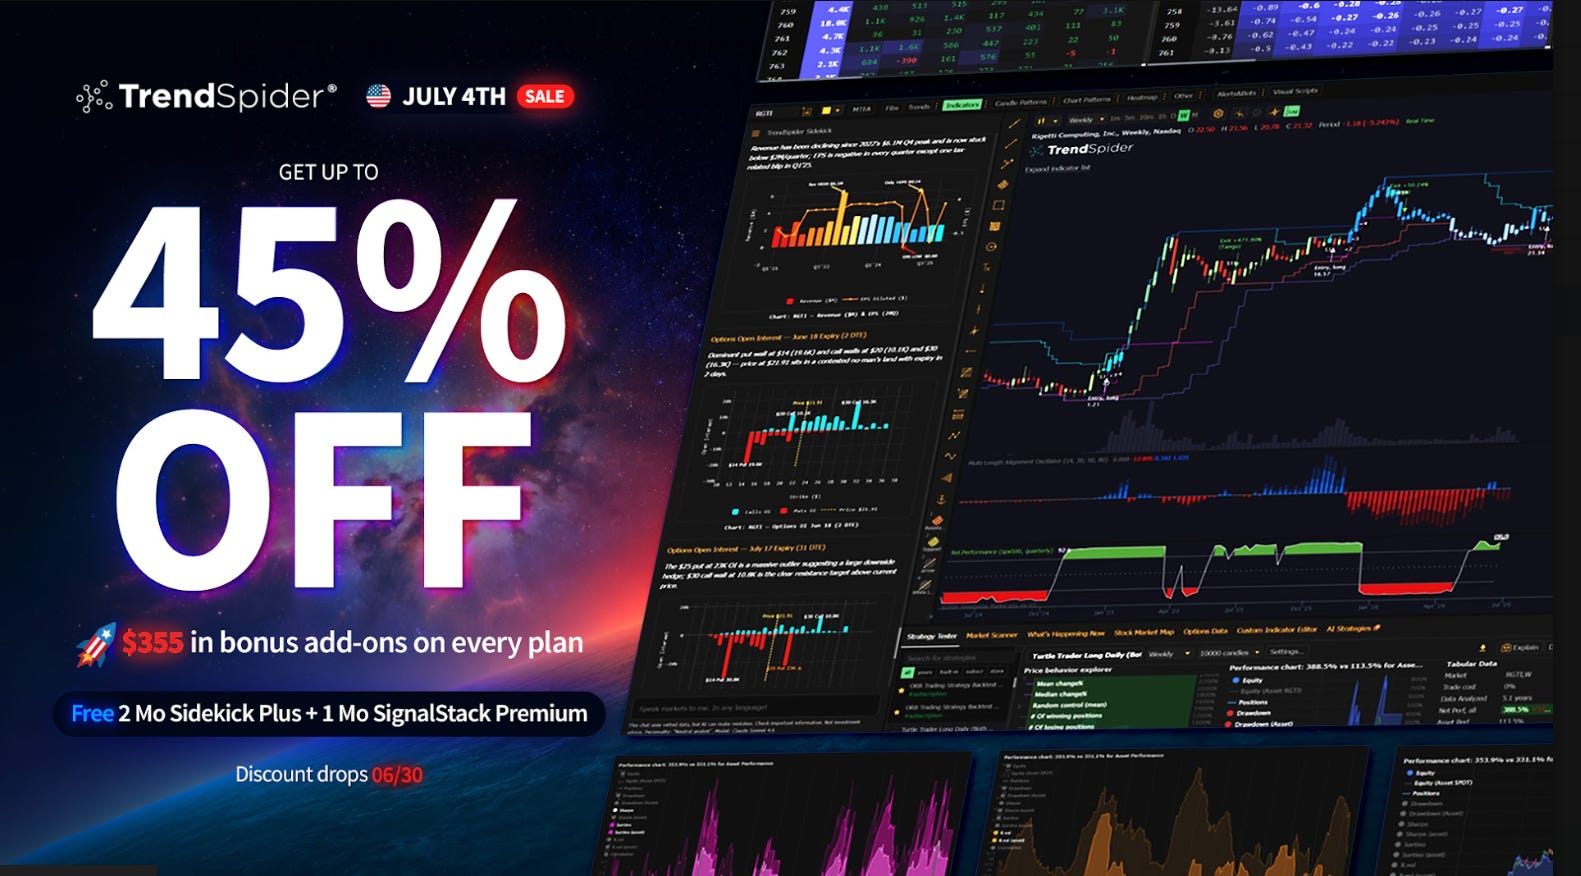
Before we move on, I want to tell you all about the charting platform I use - TrendSpider.
TrendSpider is having a 42% off +$355 in free upgrade sale that is live right now. If you’re interested, sign up by July 3rd at midnight CST to get $355 in free upgrades.
TrendSpider brings your trading research workflow into one connected platform, helping you spend less time jumping between tools and more time finding, testing, and tracking market opportunities.
Find trade opportunities faster with scanners for technical and fundamental setups.
Research market data and live portfolio holdings with Sidekick AI.
Analyze price action with charting and automated technical analysis.
Explore broader market context with real-time options, sector rotation, market breadth, news, and sentiment.
It’s an all-in-one market research and trading platform. Give it a try.
Disclosure: I may receive commission if you sign up or make a purchase through links in this post.
My biggest losers have been:
I’m only going to include stocks here with a weighting above 1% in my portfolio.
Upstart | UPST: UPST has been a poor investment for me, but I still see the opportunity in the lending market for disruption. If I’m right about capital rotation into the AI appliers, I do believe UPST will re-rate above a 14x NTM EBITDA.
Transmedics | TMDX: TMDX has always been a volatile stock but the underlying company is still performing well. Management continue to reiterate their longer term targets of 20k transplants by 2030. If that is the case, I don’t see how TMDX can continue to trade at 3.5x NTM sales or 13x NTM EBITDA based on those growth assumptions. It’s one of the stocks I continue to DCA into.
USA Rare Earths | USAR: This is my higher risk bet on the rare earth supply chain that will challenge US for the next few years. It’s currently a small position that I am holding happily as long as this $19 support level is held. If that support level is broken and we fall below the 200D MA, I’ll rethink the thesis.
UiPath | PATH: If there’s one thing to say about PATH, it’s that this $10 level has held extremely well for the time being and the last week has looked strong. I am currently down 20% on PATH with a 2.05% position.
Here’s my portfolio at H1 close:
I can’t screenshot the entire portfolio as it won’t fit…but I will screenshot as much as I can of the top half of the portfolio.
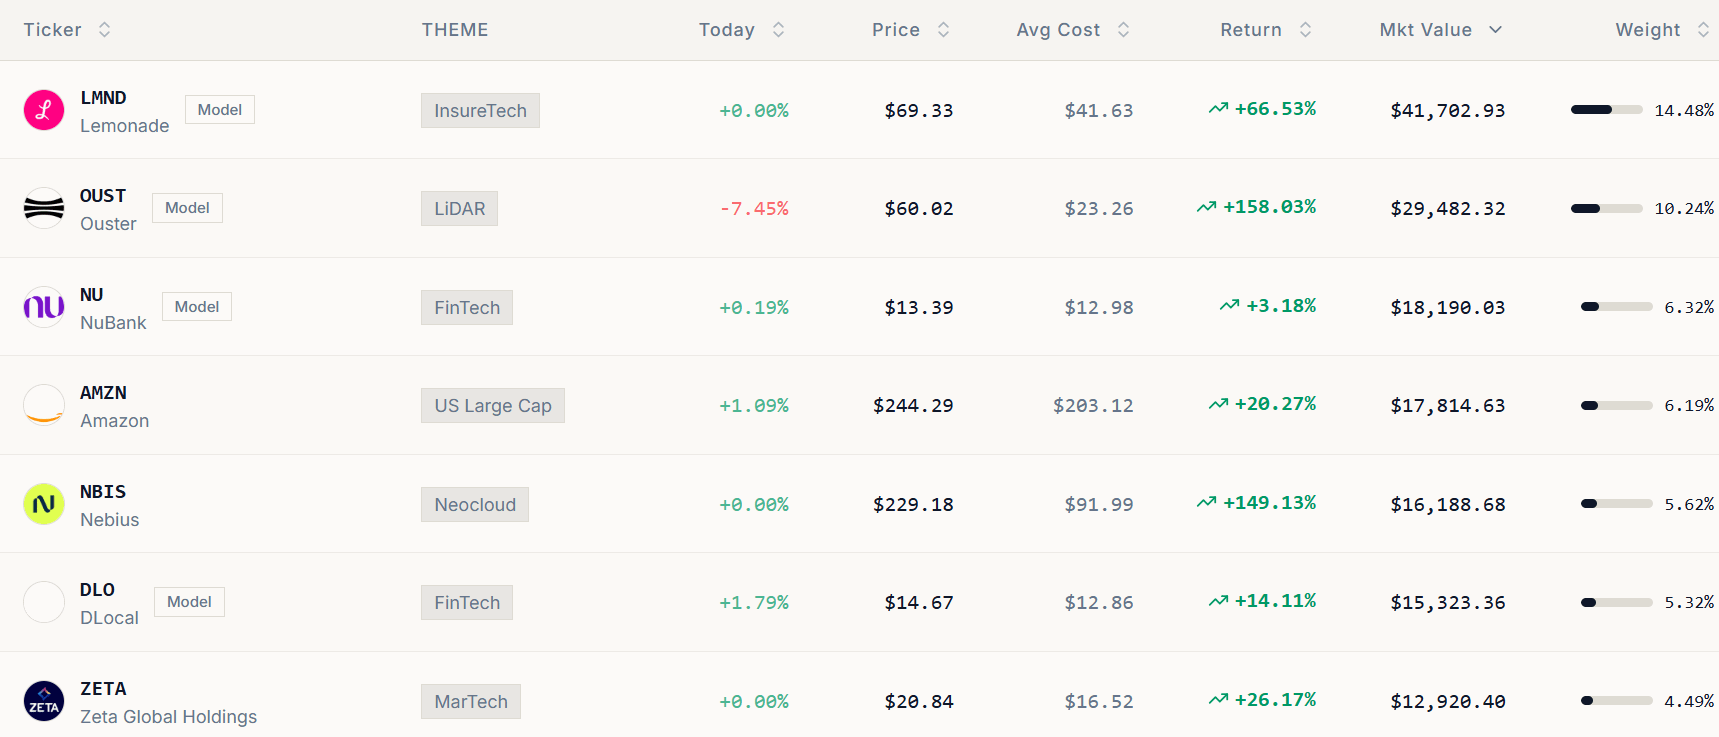
You’ll see my 7 largest positions there making up 52.6% of my portfolio as of today.
NU and DLO are both up less than 20%, OUST and NBIS are up more than 100%, and AMZN and ZETA are up more than 20%.
Here’s the rest of the portfolio:
