
How to Properly Analyze an Income Statement
The inflows and outflows of a company

Knowing how to analyze an income statement is key if you want to make good investment decisions.
At the end of the day, you want to be invested in profitable companies that aren’t in financial difficulties, and being able to understand the income statement is vital for this.
Learn everything you need to know about the income statement in this article.

The Basics
An income statement is also known as a profit or loss account.
It simply shows the company’s revenue and expenses over the financial year.
You can learn a lot about a company just by looking at the income statement. For example:
How much revenue does the company produce?
How much of this revenue is translated into income?
Is revenue growing or slowing down?
Are management efficient?
And much more.

In this article, we’re going to use Apple ($AAPL) and I’ll show you exactly what I’d do to analyze this income statement.
Revenue
It always starts with revenue.
Revenue is simply the money a company receives from selling its products and/or services.
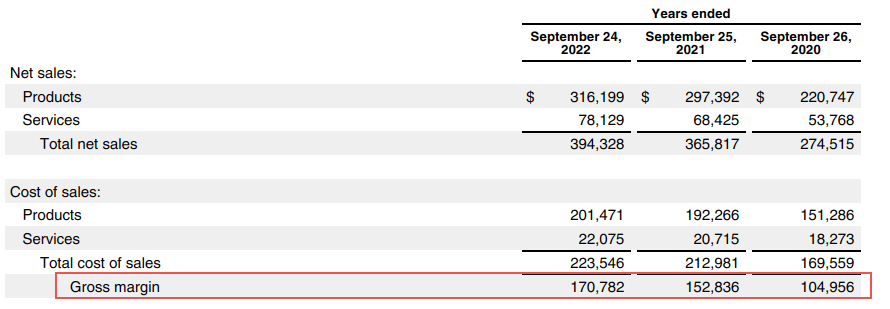
Here, Apple received a total of $394.3B throughout the year ending 2022.
Cost of sales
Cost of sales (also known as Cost of Goods Sold) shows you all the costs a company incur to produce its products and/or services.
So Apple incurred $223.5B of costs in the year ended 2022.
Gross Profit
Gross profit is simply therefore:
Gross Profit = Revenue - Cost of Sales
Apple Gross Profit = $394.3B - $223.5B = $170.7B
Now we know the gross profit we can figure out the gross profit margin %.
Gross Profit Margin % = (Gross Profit / Revenue ) * 100
Apple Gross Profit Margin % = ( $170.7B / $394.3B ) * 100 = 43.2%
Now what does this mean? Is this good?
On the face of it, 43.2% is good as the higher the gross margin, the better.
When a company has a stable and high gross margin, it is a sign that the company has pricing power.
Pricing power is just the ability for a company to raise prices without losing customers or demand. It’s a good sign of strong brand loyalty.
But we need to delve into the trend and industry averages to see how good it actually is.

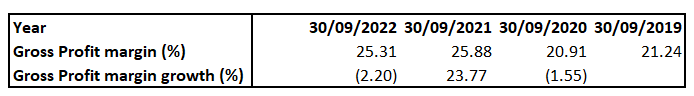
This shows the Gross Profit margin growth year on year (YoY). The large jump from 2020-2021 of 9.29% is very promising, though a 3.61% growth is still impressive.

Comparing to Apple’s main competitors, they still remain very strong falling behind only Google and Microsoft.
Operating Expenses (OPEX)
The operating expenses show you all the expenses a company makes to run its daily operations.
Operating income

Now you know OPEX, you can make sense of operating income or EBIT (earnings before interest and tax) of a company.
The operating income shows you how much money a company earns from its normal business activities.
Operating income = Gross profit - Operating expenses
Apple Operating income = $170.7B - $51.3B = $119.4B
Non-operating income and expenses
Income and expenses that aren’t specifically related to the normal course of business are classified as non-operating income and expenses.
This includes:
Other income
Gain/(loss) on financial instruments
Gain/(loss) on foreign currency
Interest expense

This is a breakdown of Apple’s other income/(expenses).
Interest income is the income earned on cash held in savings accounts, certificates of deposits, other investments etc.
Interest expense is the cost of borrowing.
Income before taxes

The income before taxes simply shows the profit/(loss) of the company before taxes.
Income before taxes = Operating income - Non-operating income and expenses
Apple income before taxes = $119.4B - $334M = $119.1B
Income tax expense
Every company has to pay tax. Crazy, right?
Apple manages to only pay 16% of tax (they’re incorporated in Ireland, amongst many other reasons), meaning their provision for tax is $19.3B.
And finally…we get to net income

The “bottom line” or net income shows how much money the company has made after subtracting all costs and taxes.
This is what we mean when we talk about “earnings” or “profit”.
We obviously want this number to be positive, but we also want this number to grow at an attractive rate. I like to see an earnings growth of more than 8% (but this isn’t a strict cut off as many factors play into whether I decide to invest or not).
Net income = Income before taxes - Taxes
Apple net income = $119.1B - $19.3B = $99.8B
Net Profit Margin
Now we can calculate the company’s net profit margin.
Profit Margin = ( Net income / Revenue ) * 100
Apple Profit Margin = ( $99.8B / $394.3B ) * 100 = 25.3%
The higher the profit margin, the better because you want to be invested into companies that can effectively translate sales into profit.
Just as we did with Gross Profit Margin, I’d also look at the recent net profit margin growth, as well as compare this margin to competitors.
Apples Net Profit Margin is a lot more volatile than Gross Profit Margin which is natural as there are most costs involved. Although the net profit margin trended slightly downwards from year ending 30/09/21, 2.2% decrease is not too worrying.
But it’s definitely worth keeping an eye on.
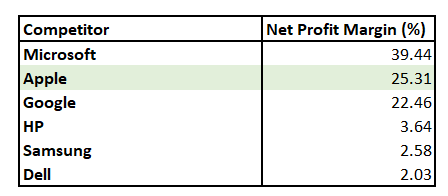
When comparing to competitors, Apples Net Profit Margin then becomes even more impressive.
We can see companies like HP, Samsung, and Dell, are all struggling to maintain strong net profit margins which would be a worry as an investor. Apple remains strong.
Earnings per share (EPS)

For shareholders, it’s useful to look at the EPS of a company.
EPS is a metric that shows how much profit a company makes for each share of its common stock.
EPS is calculated as follows:
Earnings per share = Earnings / Number of outstanding shares
Apple Earnings per share = $99.8B / 16.2B = $6.15
In Apples financial statements we also get the diluted EPS. Diluted EPS essentially also includes convertible securities into the calculation (preferred shares, stock options, warrants, debt etc), and therefore will be lower than the basic EPS.
It is a more accurate representation since it shows the full picture.
The higher the EPS, the more profitable the company is perceived to be.
How to use EPS
Firstly, EPS allows you to calculate the Price/Earnings (P/E) ratio.
This allows you to benchmark the company’s valuation against other companies in the same sector.
P/E Ratio = Stock Price / Earnings per Share
A lower the P/E ratio MIGHT indicate the stock is undervalued.
As per Bill Miller, who beat the S&P 500 15 years in a row:
You will not find value in defined in terms of low P/E or low price-to-cash flow in the finance literature. What you find is that practicing investors use those metrics as a proxy for potential bargain-priced stocks. Sometimes they are and sometimes they aren’t.
Return on Equity (ROE)
Return on equity calculates the total return on equity to determine the firms ability to turn equity into returns.
A high ROE shows pricing power and market dominance as the company are effectively using contributions of equity investors to generate profits and return those profits to investors.
This is a great supplement to the EPS calculation.
Return on equity (ROE) = ( Net income / Equity ) * 100
Putting it all together
Now we’ve covered the income statement and looked at a few important ratios, these are the questions you should ask yourself to determine whether the company is an attractive investment or not:
Are revenues and net income steadily increasing over time?
Does the company have a good gross margin?
Is the company profitable?
How much revenue is translated to net profit?
How would I go about this?
Trend analysis: Look at the trend of the company’s revenue, gross and net margins, net income, EPS, P/E, and ROE over the last 5 years. Consistent, steady growth is what we are looking for.
Comparative analysis: Compare revenue, gross and net margins, EPS, P/E, and ROE to competitors in the same sector.
Look at ratios as one: Just because a company may have a high EPS, does not mean it is an attractive investment opportunity. Use financial ratios alongside each other to get a holistic view of a company’s financial health.
Fully understand the company’s net income: Understand the factors that affect a company’s net income as this is the backbone of all other financial ratios. Ensure that costs are under control, and revenue is predictable and robust.
That’s it for today
I hope you found this article valuable in your quest to become a top investor.
Do you want more from me here at Make Money, Make Time? Please subscribe to my Subscribe to my Substack where I provide investors with insights and knowledge on a weekly basis.
If you have any suggestions to further improve my posts (such as structure, style, or topic recommendations), then please comment below.
About the author
Make Money, Make Time is written by Oliver, a qualified CA, and investor who has read over 300 investment books, and spent more than 50 hours per week researching stocks so that you don’t have to.