

Despite what many for some reason assume, NBIS remains in its early days of AI build out and in my opinion, the early days of its stock price gains over the next 5 years.
I’m going to highlight in this article how I see the stock moving from a $60B MC at $221 today to much higher whilst also showing you a range of situations that may happen and the associated stock prices so you can best gauge your estimates.

The goal though isn’t to give you a single price target. It’s to give you my personal view… and also a range of likely situations in 2030.
As with all modelling, a lot of this work requires assumptions. Sometimes I may be too aggressive and sometimes I may be too conservative. But based on current trends, management guidance, and industry wide forecasts I think I’ve got pretty close to what will likely happen.
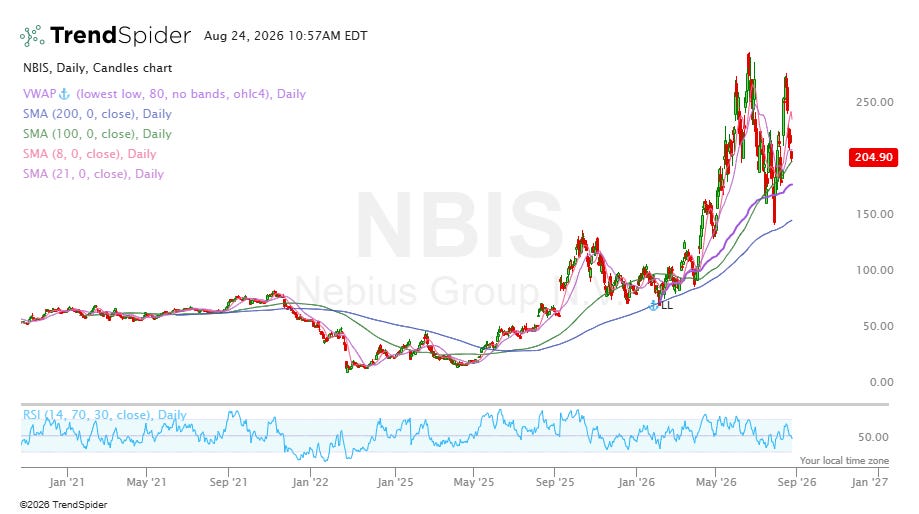
The facts we can be slightly more sure on:
Contracted Capacity
Management has guided us towards 5 GW of capacity to be contracted by year end 2026, with more than 1 GW of additional capacity planned for deployment each year beginning in FY27.
“We continue to build our future capacity pipeline through our own and colocated sites, and today raise our year-end contracted power target to 5 gigawatts. Our future capacity pipeline effectively makes Nebius one of just a few companies in the world able to build more than 1 gigawatt of new capacity a year. And we plan to do so in 2027.”
Connected Capacity
This path therefore produces ~5.2 GW of connected capacity by the end of FY30 if execution remains in line with management forecasts.
“Almost all of that power will come online over the next 3, maybe 3.5 years out of the contracted power.”
A lot of the numbers used in this work are based on this 5.2 GW of connected capacity so here’s a bit more depth on it.
So starting from YE 26, that points to the bulk of today’s 2026 forecasted 5 GW being connected in mid-2029 to 2030 starting from today’s base rate ~800 MW-1 GW.
5.2 GW is therefore not the most aggressive interpretation of the current commentary.
The risk to this forecast is grid interconnection which is structurally more of a nation wide risk. The grid simply can’t meet new demand quickly which is why we’re being forced into the behind-the-meter power solutions and power generation systems that do not rely on the grid.
Right now, we’re seeing grid-interconnection queues above 2,000 GW with an average wait time of ~5 years (application to operation). Only ~13% of projects that entered application before 2019 actually reached operation.
The more positive take for NBIS is that site selection and strategy is built around the interconnection issue.
75% of contracted capacity is sourced from owned, BTM generation (Bloom Energy fuel cells and Vineland), a natural gas power station in Missouri, and a site in Pennsylvania. None of these are stuck in the 2,000 GW queue.
Site selection and strategy is therefore the moat.
Annual Contract Value
More recent landmark contracts are valued at ~$20-25 million of ACV (annual contract value) per MW. Worth noting that original levels were ~$12 million.
My personal base case that reflects:
Customer mix
Ramp timing
Difference between contracted and fully revenue generating capacity
Gives me a deliberate haircut (I always model conservatively) of a blended ACV per MW of $14M.
5.2 GW * $14M = $72.8B ARR by 2030 (this is my base case we will work from)
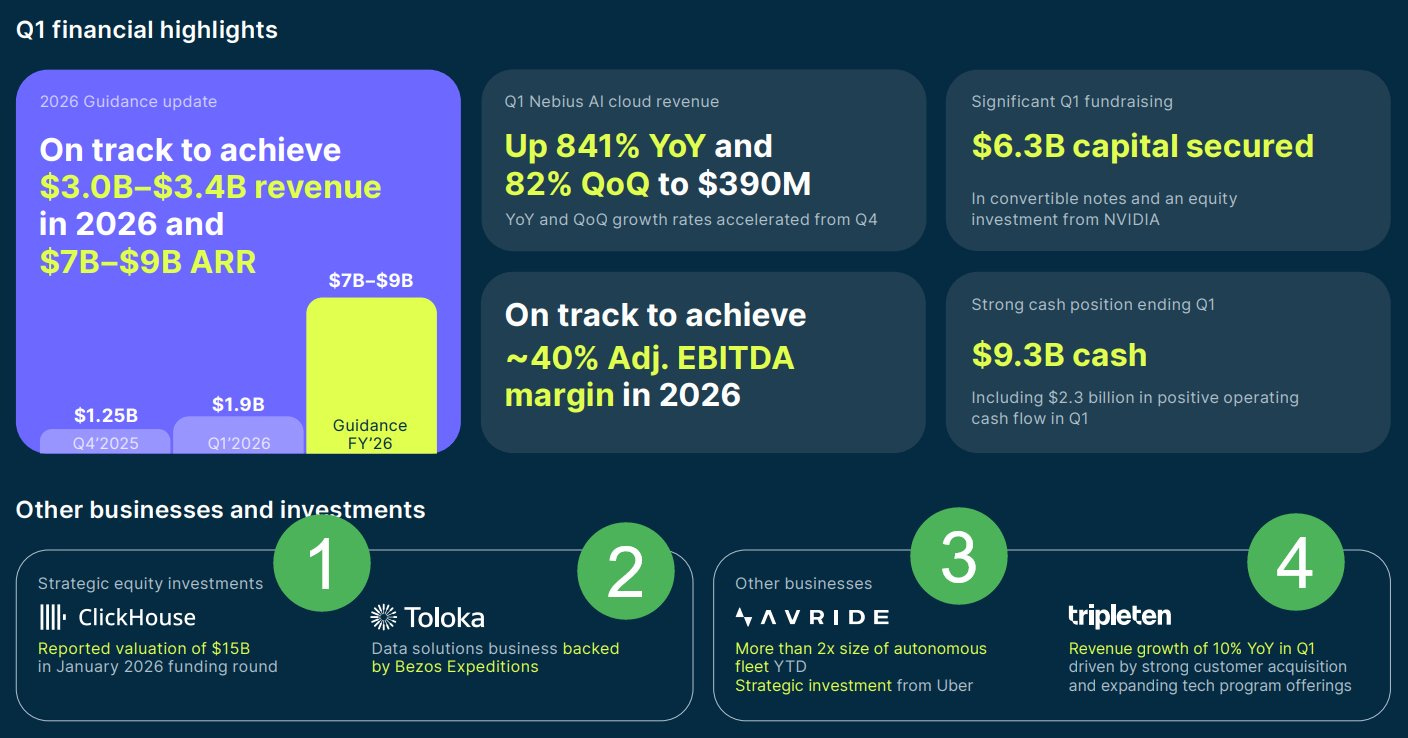
That’s roughly a 9.1x increase in ARR from YE26 to YE30 which is entirely capacity driven with a conservative ACV.
I’ll get into the valuation section after this but on the face of it a 9.1x increase in ARR in 4 years whilst trading at 8.8x NTM sales isn’t expensive.
ARR Forecast: Bullish Case
I think my assumptions above are a solid base case.
I do want to include a more bullish take so here it is. It’s quite in line with a model that Wells Fargo put out where we reach 7.5 GW of active infrastructure by 2030.
From here, Wells Fargo also used a more positive revenue per MW than my assumptions.
“These deals were for an average of more than $1 billion each. They represent a yield of $20 million to $25 million per megawatt.”
“You should expect the deals we closed in this quarter with more than $20 million per megawatt deals and less than 2-year payback period.”
Industry benchmarks for a fully utilized GPU data center are closer to $20-22M per MW which could push our 2030 ARR up to +$150 billion.
I understand this is a bull case but this is the far more likely scenario vs the below bearish take.
ARR Forecast: Bearish Case
Wolfe Research have put out numbers suggesting we see $41.2B in ARR by 2030 based on 5 GW (potentially not all fully online or fully utilized on day one of 2030 though).
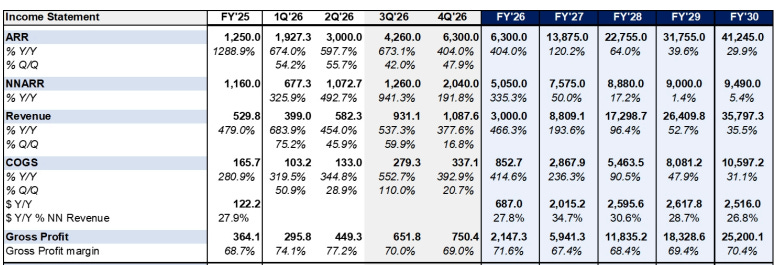
An exact $ per MW is not clear but based on 5GW of active capacity we’re likely looking in the region of $8.24M which seems incredibly low to me. It’s based on:
Normal utilization rates, ramp timing lags, and some capacity that is reserved or not yet at peak density.
Mix of older, lower-priced contracts still in the base.
Seems like a heavy haircut to me, but one we should consider and one I’ll work from for a potential share price in each section as well.
Methodology 1: EBITDA
Note: This is all based on a $72.8B ARR.
Full disclosure here: I’m aware a pure EBITDA look may not be the best representation of valuing a capital intensive business like NBIS but when FCF is likely negative or very slim through 2030…you can’t run a clean looking DCF model.
EBIT / ROIC is a nice way of looking at the economics but it’s not a common valuation method to compare to peers today. In my next method, I do look at ROIC.
EBITDA is the purest metric we can use right now. It’s just important we take into account and understand the downsides of using this and that these share prices are likely a little inflated.
Group margin currently sits ~41% with management indicating we should see margins stabilize ~45% once we reach scale.
I’ll be using 45% as my base case longer term assumption but will model between 35% and 45% through to 2030.
$72.8B * 45% → $32.8B
$72.8B * 40% → $29.1B
$72.8B * 35% → $25.4B
An EBITDA of $32.8B which results in a 124% CAGR over a 4 year period.
124% CAGR (4Y) is arguably one of the highest growth rates we’ll see amongst all stocks I follow and deserving of a high growth associated multiple.
EQIX trades at 23x NTM EBITDA based on 13% CAGR
DLR trades at 23x NTM EBITDA based on 13% CAGR
CRWV trades at 8x NTM EBITDA based on 71% CAGR (CRWV has far higher net debt and is lease heavy vs NBIS owned sites).
Here’s a bull to bear case:
Bull: 25x * 32.8B → $820B EV
Base: 15x * 32.8B → $492B EV
Bear: 10x * $32.8B → $328B EV
Net Debt
Assumptions for net debt are as follows:
Net debt is currently ~$2B. Forecasts and maths based on ~$30-38M per MW assume gross invested capital will be ~$156B - $198B.
Here’s what we know on the further details here:
Customer prepayments are expected to cover ~50-60% of associated CapEx on large deals.
Convertible notes (~$15B) will fill residual gaps.
Operating cash flow should become a growing internal funding source.
So, if ~50% of CapEx is covered by prepayments + growing OCF, external capital needed will be in the $70-90B range.
Before I go into the numbers, I just want to be clear that NBIS’s strategy so far has been stellar in terms of their cost of capital. They’re already starting to look like a hyperscaler.
Most neoclouds still fund growth primarily through equity which is pricey and creates this repeated cycle of dilution → deployment → depreciation.
NBIS is already at a stage where they’re accessing asset-backed debt which is collateralized by investment-grade customer contracts. The recent $775M debt facility is collateralized by contracted cash flows from investment grade customers which means lenders are effectively underwriting the credit of counterparties such as META and MSFT rather than NBIS itself.
NBIS management indicated that this can essentially be repeated across the entire $40B of backlog.
Then as discussed we have prepayments directly funding new capacity as well which should mean this dilution figure isn’t as bad as we see tend to see in the neocloud industry.
I think a conservative range is therefore to assume net debt in 2030 is between $40B (bull case) to $80B (bear case).
So if we take the higher end of this range off our EV’s we get the following equity values:
$820B - $80B → $740B
$492B - $80B → $412B
$328B - $80B → $248B
These are equity values far above today’s $60B range.
Dilution
The next stage of assumptions is dilution. I’ll model my dilution out here and then re-use in the below methods too.
It’s also really important to note that the economics of this business sway between being extremely good and not great on quite slim changes.
I.e. if NBIS do manage to work towards +$100B in ARR then operating cash flow starts to cover far more of the CapEx than I am assuming here which in turn means less debt and less dilution.
This is entirely a story based on how quickly NBIS can convert to connected capacity, and from there how quickly they can get that blended $ per MW up close to +$20M per MW and beyond.
Modelling share count is obviously a challenge but today’s starting point is 274 million. We have:
$5B convertible note that will:
2030 notes convert at $313 → 7.98M shares
2034 notes convert at $325 → 7.7M shares
Pre-funded warrants at $2B at implied stock price issuance adding ~8.9M shares.
Ongoing SBC which could add ~5M shares (conservative take).
That’s an additional 22M shares of known dilution added. I’m going to apply another 55M share dilution to account for the additional equity capital raises I expect will be required for the 4.2 GW buildout from here assuming average issuance prices at above today’s levels.
This gives me 351M shares as a base case to work from for the 2030 outstanding number of shares. 351M shares in 2030 is a 6.3% dilution per annum from here which again I think is on the more conservative side of where we actually end up.
Share Price
Therefore we have:
$740B / 351M → $2,108
$412B / 351M → $1,174
$248B / 351M → $707
EBITDA methods will likely give NBIS an inflated share price so I think taking these with a pinch of salt is the best bet.
More bullish case (based on connected capacity and $ per MW)
Assumptions:
ARR: $150B (see above)
EBITDA margin: 45% (see above)
Share count: 351M shares (see above)
($150B * 45%) * 25x / 351M → $4,808
($150B * 40%) * 15x / 351M → $2,564
($150B * 35%) * 10x / 351M → $1,496
More bearish case (based on connected capacity and $ per MW)
Assumptions:
ARR: $41.2B (see above)
EBITDA margin: 45% (see above)
Share count: 351M shares (see above)
($41.2B * 45%) * 25x / 351M → $1,321
($41.2B * 40%) * 15x / 351M → $704
($41.2B * 35%) * 10x / 351M → $411
Note: The business is valued a lot like this today on a pure 17x NTM EBITDA multiple for the most part. That won’t be the case forever.
There will likely be a case soon where margins, where FCF conversion, where CapEx comes under a lot more scrutiny and that will come if/when we get more of an prolonged drawdown.
It’s why I don’t love this above approach when looking out for 2030 onwards.
Methodology 2: EBIT
A longer term DCF approach is ideally the best way to value NBIS at today’s inflection stage because of the multi-year capacity buildout ahead. The issue is based on current forecasts we’re likely looking FCF negative until ~2030-2032.
The main goal with this approach is to quantify the capital required to get to this capacity peak with a realistic funding mix and depreciation.
Here’s a clean walkthrough for you (based on the same assumptions of 5.2 GW and a blended $14M / MW:
