
Link for January 2026 Spreadsheet/Portfolio
A quantitative approach

Hi all,
As promised, behind the paywall below is the link to my January 2026 spreadsheet. As paid subs know, this is where I post all of my current holdings, allocations, trades, buys, sells, adds, trims, watchlists, ideas, thematics, and exact dollar amounts I have.
I made some upgrades to the 2025 spreadsheet. I’m going to use this article to give a brief overview of what the spreadsheet offers and how you can all use it.
Before we jump into that, enjoy this 5 minute read (for all free subscribers) which gives a nice overview of 2025, and my thoughts going into 2026.

Here’s how my 2026 spreadsheet works:
Tab 1: “Portfolio”
My core portfolio including exact dollar amounts.
My exposure (broken up into geography and themes). I’m currently weighted ~44% into US tech but that is broken down further on another tab.
Everything here is formula driven so you can go in to this tab whenever you like and see updated prices, updated PnLs, updated allocations etc. It’s the big overview.
Tab 2: “Portfolio Valuations”
In this tab I’ve broken down my portfolio using a nice quantitative approach measuring revenue and EBITDA expected growth rates vs current NTM multiples. It’s a nice way of screening out some stocks in my opinion and it’s a nice basis for a lot of the work I do, though of course a lot more analysis goes into it than that. This is purely a quantitative angle.
Since I showed my top 6 positions yesterday in my 2025 recap, here’s a sneak peak into what my approach tells me for these 6 stocks today on 01/04/2026. This will of course change on a daily basis as the spreadsheet updates itself.
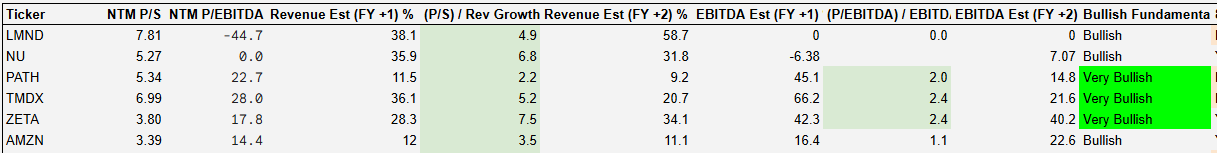
I generally look for stocks where revenue growth rates are 2x or more the current multiples and where EBITDA growth rates are ~1.5x more than the current multiples. You’ll see that PATH, TMDX, and ZETA all return “Very Bullish”, whilst LMND, NU, and AMZN return “Bullish”. I wouldn’t expect AMZN to perform well within this criteria as this specific approach is geared towards finding some high growth names. That’s why it’s just a small part of the overall analysis I do.
LMND is yet to be EBITDA profitable so that’s why it doesn’t return “Very Bullish”. My formula incorporates revenue and EBITDA growth.
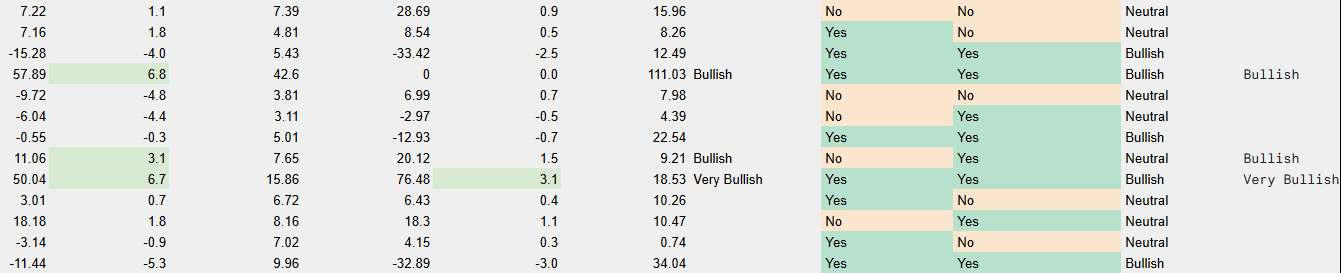
The other part of this tab includes a look at technicals in terms of price relative to moving averages. I tend to look for stocks with a bit of short-term momentum (8 day moving average above the 21-moving average for example). Again, this is all formula driven.
I’ve got this for all 39 stocks in my current portfolio (core portfolio and swing trade portfolio).
Tab 3: “Watchlist”
This is also a very formula driven approach.
I currently have a watchlist on here of 45+ stocks across robotics, optics, quantum, healthcare, Mag 7, semiconductor supply chain, data center & manufacturing, battery tech and energy storage etc.
The most comprehensive part of my spreadsheet is with robotics and optics because these are the two themes I have focused most on so far. I’ll be adding far more themes to my spreadsheet over time though. I am aiming for one per week.
Here’s my robotics and optics write ups.


Here’s an example of IREN on my watchlist:

I have an entry price per technicals (support levels, fib levels, moving averages etc) and an entry price per fundamentals (valuation, moat etc etc). From there the formula spits out whether this is of interest to me today or not.
Just to reiterate: This is not the sole decision maker of if I invest in a stock or not. Much more goes into it and there’s much more I do rather than just this spreadsheet. But it’s definitely a nice value add that drives me to delve deeper into certain stocks or not.
Tab 4: “Exposure”
This is just a more detailed breakdown of my exposure to certain themes.
Tab 5: “Buys/Sells 2026”
This is where I upload all portfolio moves (adds, trims, buys, and sells). I also upload this on Tab 1 and also update all paid subs in real time in the Substack chat, so I make it very clear whenever I change my portfolio or not.
On this tab I have created a formula that tracks my average costs and shares held which then pulls directly through to tab 1 (portfolio).
This is all timestamped.
Tab 5: “Robotics”
On this tab I used my robotics writeup (linked above) to breakdown quantitatively how attractive all of these stocks as per my criteria. There are 110+ stocks on this tab alone for robotics.
Here’s a sneak peak of it. Stock tickers are all to the far left so I’ve hidden that here for paid subs who have access to the spreadsheet.
Tab 6: “Optics”
Exactly the same as robotics, but for optics.
Tab 7 onwards:
I’ll be updating these tabs on a weekly basis as I dive through the different key themes I want to focus on. The next few will be:
Space
Indium Phosphide Bottleneck
AI Applications
Insurance Marketing
I aim to have ~20+ themes to track here.
There are a few other tabs in the spreadsheet as well (2025 buys and sells which are all timestamped) and a couple of valuation models. I will be adding valuation models for my biggest positions in here (PATH, ZETA, TMDX etc).
I hope that provides a nice overview of the spreadsheet. It’s all quite self-explanatory and you can use it as little or as much as you want. On top of this I obviously am in daily communication with my paid subscribers so don’t feel like you need to be on the spreadsheet all the time (if ever if you prefer not to).
I send 5-20 messages per day normally analyzing what I’m seeing in the markets, opportunities, and portfolio changes etc.
I will be keeping my paid service at $16 a month for the entire month of January. From then on, the prices will go up but if you begin as a paid subscriber now you will lock in the $16 a month (or $160 per year) price for the rest of the time you are a subscriber.
I’m going to put the paywall now below this and the link to the spreadsheet will be there.
Keep reading with a 7-day free trial
Subscribe to MMMT Wealth to keep reading this post and get 7 days of free access to the full post archives.